
If you’re navigating the exciting world of forex trading, understanding the most profitable chart patterns can be a game-changer for your financial journey. These patterns, like head and shoulders, double tops and bottoms, and triangles, hold the key to predicting market movements and making informed trades. By mastering these strategies, you can elevate your trading game and increase your profitability. To dive deeper and gain a comprehensive understanding, check out my forex trading Udemy course where I break down these concepts with hands-on examples and real-world applications. This course could be the boost you need to maximize your trading potential. Have you ever looked at a stock or forex chart and felt like you were staring into a maze? You’re not alone! The financial market charts can look really confusing at first glance. But here’s some good news: By learning a few profitable chart patterns, you can navigate this maze confidently and make informed trading decisions.


Why Chart Patterns Matter
Chart patterns are like the signposts in the financial markets. They help you navigate through the ups and downs, allowing you to make informed buying and selling decisions. By recognizing these patterns, you can better predict future price movements, ultimately leading to more profitable trades.
Understanding chart patterns can turn you from a novice trader into a pro. They offer insights into the psychology of other traders, revealing when traders are most likely to buy or sell. And guess what? We’ve got just the guide to get you started.
The Magic of Forex Trading Patterns
Let’s dive into some of the most profitable chart patterns that you can start using right away. Whether you’re into forex trading or stock trading, these patterns can be immensely helpful. And if you want to delve deeper, don’t forget to check out my comprehensive forex trading course on Udemy – it’s packed with actionable insights and strategies!
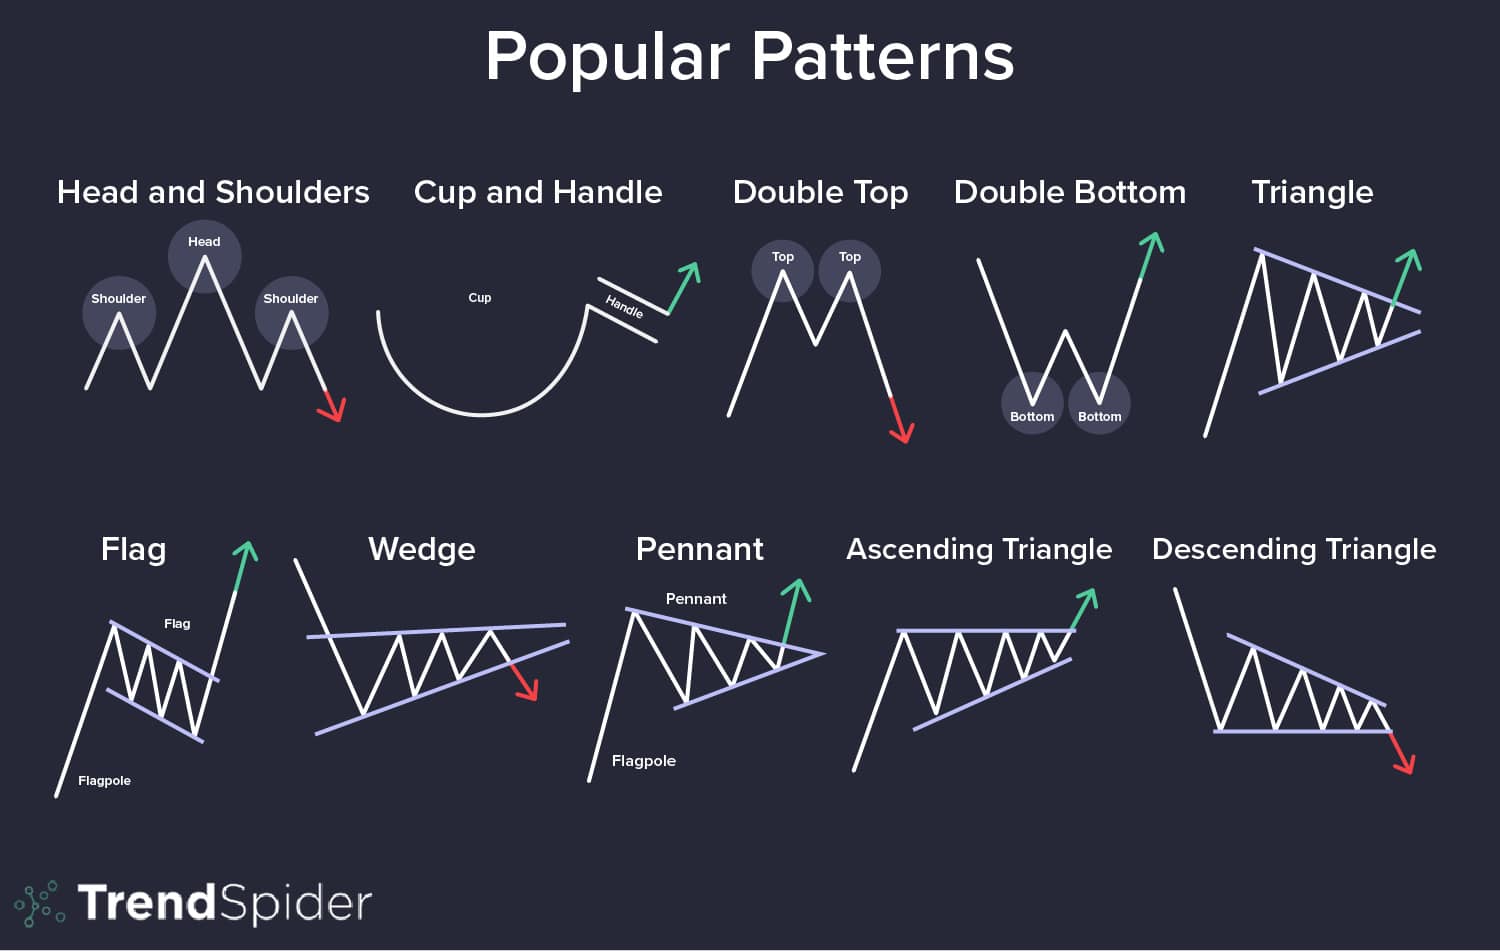
Head and Shoulders Pattern
The Head and Shoulders pattern is one of the most reliable and profitable chart patterns out there. It signals a reversal in trend and can give you great entry and exit points.
Identifying the Pattern
Here’s how to identify it:
- Left Shoulder: Prices rise and then fall.
- Head: Prices rise again to a higher peak and then fall.
- Right Shoulder: Prices rise once more but not as high as the head before falling again.
This pattern often looks like three peaks, with the middle peak being the highest (the head). The other two are the shoulders.
Trading the Pattern
Once you’ve identified this pattern, you can place your trades effectively. Typically, you would place a sell order as the price falls from the right shoulder.
| Stage | Action |
|---|---|
| Left Shoulder | Wait and watch |
| Head | Prepare for possible entry |
| Right Shoulder | Place sell order |
It’s as simple as that! But remember, always use stop losses to minimize risk.


The Double Top and Double Bottom
The Double Top and Double Bottom patterns are another set of highly profitable chart patterns. These are reversal patterns that signal a change in the current trend.
Double Top
This pattern occurs when the price hits a resistance level twice and then starts to fall. It looks like the letter “M” on the chart.
Double Bottom
This pattern occurs when the price hits a support level twice and then starts rising. It looks like the letter “W” on the chart.
Trading these Patterns
For Double Top:
- Place a sell order as the price falls after the second peak.
For Double Bottom:
- Place a buy order as the price rises after the second trough.
Here’s a quick summary in table form:
| Pattern | Identification | Trading Action |
|---|---|---|
| Double Top | Two peaks at resistance level | Place sell order after second peak |
| Double Bottom | Two troughs at support level | Place buy order after second trough |
Rounding Bottom
The Rounding Bottom pattern is another gem when it comes to profitable chart patterns. This pattern signifies a gradual shift from a downtrend to an uptrend, providing a good indicator for long positions.
Identifying the Pattern
A Rounding Bottom looks like a “U” shape. Prices slowly decline to form the bottom of the “U” and then gradually start rising.
Trading the Pattern
When you see this pattern forming, consider placing a buy order as the price starts to rise. Place your stop loss just below the lowest point of the rounding bottom to minimize risk.
| Stage | Action |
|---|---|
| Downtrend | Wait and observe |
| Formation of “U” | Start preparing for entry |
| Uptrend | Place buy order |

The Cup and Handle
The Cup and Handle is a continuation pattern that can lead to highly profitable trades. This pattern indicates that a bullish trend is likely to continue after a brief period of consolidation.
Identifying the Pattern
The pattern looks like a tea cup. The cup is a curved “U” shape, followed by a smaller consolidation period that forms the handle.
Trading the Pattern
Once the handle forms and the price breaks above the resistance line, it’s a good indicator to place a buy order. This breakout usually signals that the previous uptrend will continue.
| Stage | Action |
|---|---|
| Formation of Cup | Wait and watch |
| Formation of Handle | Start preparing for entry |
| Breakout | Place buy order |
Rising and Falling Wedges
Wedges are another profitable chart pattern to keep an eye out for. Rising and falling wedges indicate potential reversals in the market.
Rising Wedge
A rising wedge is formed when the price is making higher highs and higher lows but the trend lines converge. This pattern signals a potential downtrend.
Falling Wedge
A falling wedge is the opposite. It forms when the price makes lower highs and lower lows, with the trend lines converging, indicating a potential uptrend.
Trading the Patterns
For Rising Wedge:
- Place a sell order once the price breaks below the lower trend line.
For Falling Wedge:
- Place a buy order once the price breaks above the upper trend line.
| Pattern | Identification | Trading Action |
|---|---|---|
| Rising Wedge | Higher highs and higher lows | Place sell order on breakdown |
| Falling Wedge | Lower highs and lower lows | Place buy order on breakout |

The Flag and Pennant Patterns
Flags and Pennants are continuation patterns that indicate a temporary consolidation before the previous trend continues. These patterns are short-term and can lead to quick profits.
Flag
A Flag pattern looks like a small rectangle sloping against the previous trend. For example, in an uptrend, the flag would slope downwards, and in a downtrend, it would slope upwards.
Pennant
A Pennant looks like a small symmetrical triangle that forms after a strong price movement.
Trading these Patterns
For Flag:
- In an uptrend, place a buy order if the price breaks above the upper trend line.
- In a downtrend, place a sell order if the price breaks below the lower trend line.
For Pennant:
- Similar to the flag, place your orders in the direction of the breakout.
| Pattern | Identification | Trading Action |
|---|---|---|
| Flag | Small rectangle sloping opposite to trend | Place order on breakout in trend direction |
| Pennant | Small symmetrical triangle | Place order on breakout in trend direction |
The Symmetrical Triangle
The Symmetrical Triangle is another pattern you should get familiar with. This pattern is formed when the price makes lower highs and higher lows, leading to the convergence of the trend lines.
Trading the Pattern
The Symmetrical Triangle can break in either direction, so you’ll need to be alert. Place a buy order if the price breaks above the upper trend line and a sell order if it breaks below the lower trend line.
| Pattern | Identification | Trading Action |
|---|---|---|
| Symmetrical Triangle | Lower highs and higher lows, converging trend lines | Place buy or sell order on breakout in respective direction |

The Importance of Stop-Loss Orders
As you explore these chart patterns and start placing your trades, it’s vital to use stop-loss orders. A stop-loss order closes your position if the price moves against you by a certain amount, minimizing your potential losses.
Setting Your Stop-Loss
For reversal patterns like Head and Shoulders and Double Top/Bottom:
- Set your stop-loss just above (for sell orders) or below (for buy orders) the recent highs or lows.
For continuation patterns like Cup and Handle or Flag:
- Set your stop-loss just outside the consolidating range.
| Pattern Example | Ideal Stop-Loss Placement |
|---|---|
| Head and Shoulders | Above the right shoulder (for sell order) |
| Double Top | Above the second peak (for sell order) |
| Rounding Bottom | Below the lowest point of the “U” |
| Cup and Handle | Below the handle |
Combining Chart Patterns with Other Indicators
While chart patterns are incredibly useful, their accuracy improves when combined with other technical indicators like Relative Strength Index (RSI), Moving Averages, and Bollinger Bands.
RSI (Relative Strength Index)
RSI helps you determine whether a stock is overbought or oversold. Use it along with chart patterns to get a better picture of market conditions.
Moving Averages
Combine moving averages with chart patterns to confirm trend changes. For instance, a crossover of the 50-day moving average by the 200-day moving average can confirm a Head and Shoulders pattern.
Bollinger Bands
These are great for identifying overbought and oversold conditions. When combined with chart patterns, they provide a clearer picture of potential breakout or breakdown levels.
Wrapping It All Up
We’ve covered some of the most profitable chart patterns you can use to make informed trading decisions. From the reliable Head and Shoulders and Double Top/Bottom to more complex formations like the Symmetrical Triangle and Flag patterns, these strategies can significantly improve your trading game.
Key Takeaways
- Head and Shoulders: A strong reversal indicator.
- Double Top/Bottom: Signals market reversals.
- Rounding Bottom: Indicates a gradual trend reversal.
- Cup and Handle: A bullish continuation pattern.
- Rising/Falling Wedges: Signal potential trend reversals.
- Flag and Pennant: Short-term continuation patterns.
- Symmetrical Triangle: Can break in either direction, so stay alert.
Remember, trading is both an art and a science. The more you practice and educate yourself, the better you’ll get. If you want to dive deeper into the world of forex trading and develop a more nuanced understanding of these patterns, check out my comprehensive forex trading course on Udemy. It’s packed with detailed information, practical trading strategies, and expert tips to help you become a successful trader.
So what are you waiting for? Start exploring these chart patterns today and see how they can help you unlock more profitable trades. Happy trading!
